
Install the browser extension
Add Struct Guide from the official Chrome or Edge extension store.
Chanlun structures at a glance
Draw fractals, strokes, segments and zhongshu on the web chart you already use. Save and replay the structure to review how it formed.
Based on Chanlun.
Drawing rules are public. Review the detection conditions, parameters and confirmation rules. View the rules overview (Simplified Chinese) →
Tool layers
Show fractals, strokes, segments and zhongshu on the same web chart. Toggle each layer as needed.
Struct Guide is Chanlun auto-drawing software delivered as a browser extension. It draws structures on supported web charts without importing formulas into a market data client.
Open a supported chart and see fractals, strokes, segments and zhongshu on the original chart. The latest stroke may still move; solid and dashed lines distinguish confirmed from unconfirmed structure.
Save the current chart and its drawn structure to your library, then add your own notes. Pick up from that snapshot whenever you review or organize your work.
Replay structural events, not just candle by candle. See when a fractal appeared, when a stroke or segment was confirmed, and how the picture changed along the way.
Add Struct Guide from the official Chrome or Edge extension store.
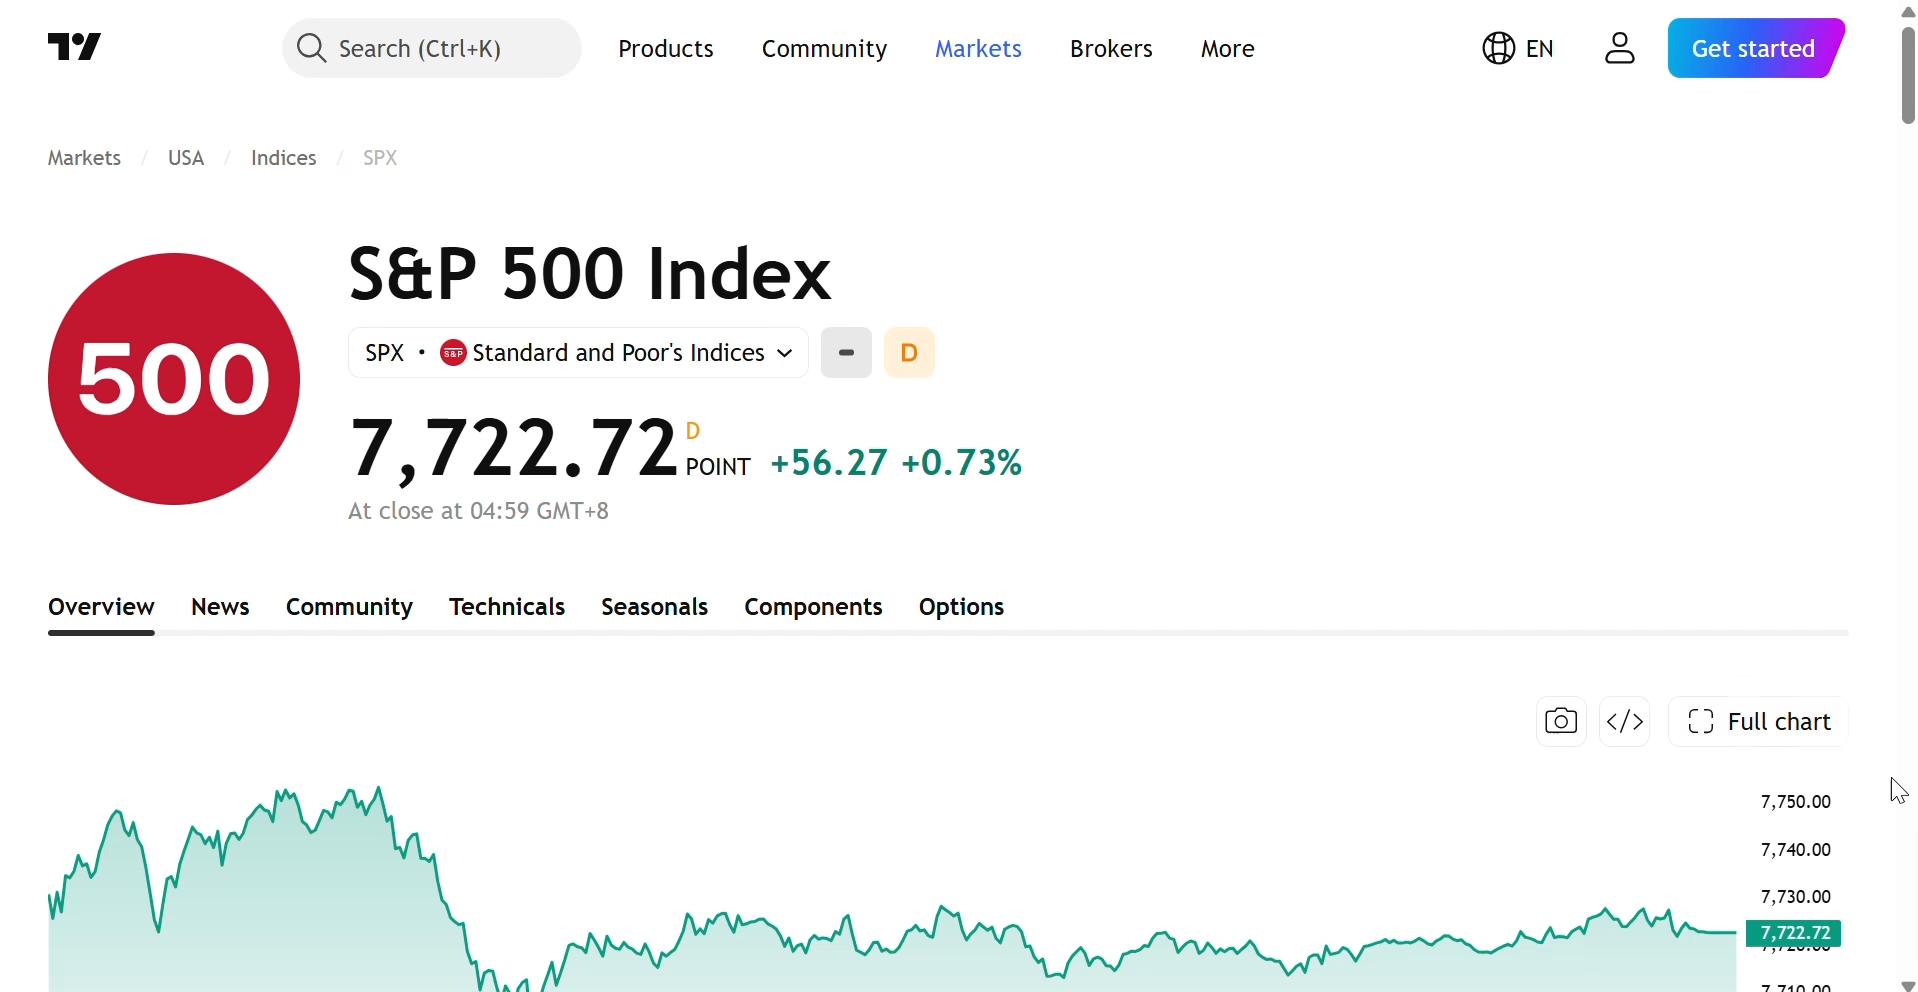
Visit a single-symbol chart on TradingView, moomoo or another supported website.
Use the on-chart panel to show or hide fractals, strokes, segments and zhongshu.
All six websites below are supported. Available markets, timeframes and chart modes vary by site and depend on the data each site provides.
The websites above are listed solely to indicate compatibility. This product is not affiliated with or partnered with any of them.
Install the extension, open a supported chart and start observing the structure.